Trend Analysis of Transit Crime Complaints and Subway Ridership
Key Takeaways
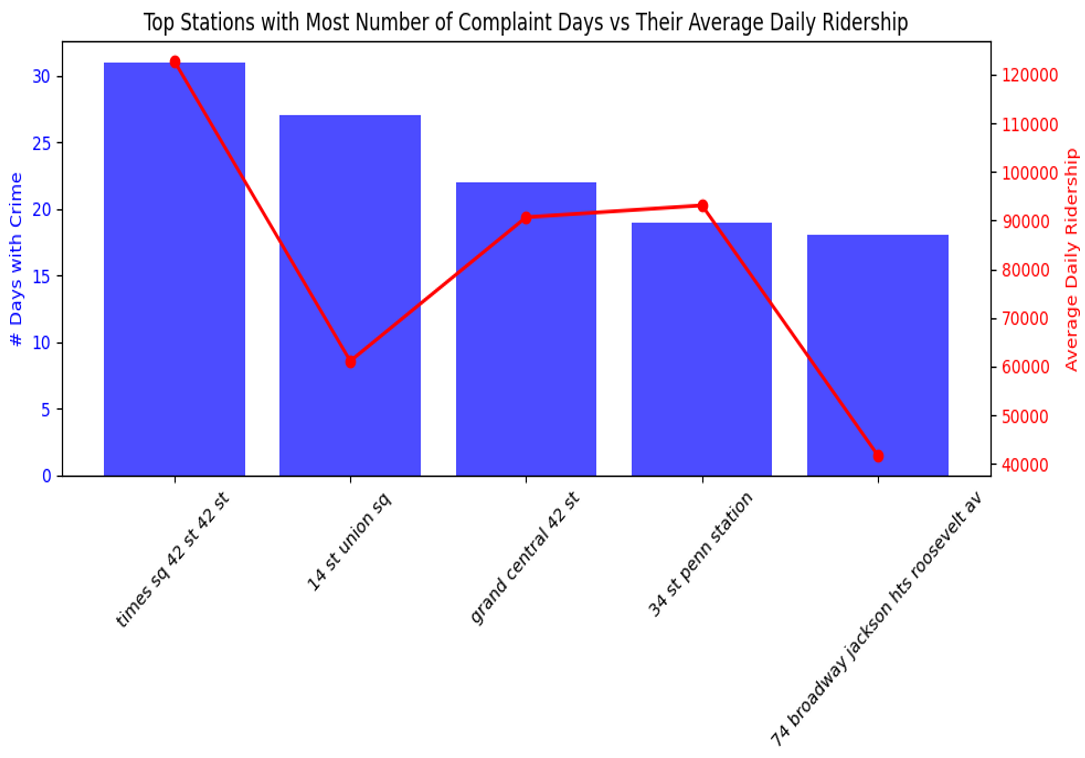
Crime-Ridership Correlation
Complaints generally rise with ridership, except at 14 St–Union Sq and 74 Broadway – Jackson Heights, where complaints are high despite low ridership.
T-tests suggest the complaint anomaly is likely due to chance, not differences in average ridership.
A weak cross-correlation index of 0.18 indicates that complaint volume had no significant effect on ridership at these stations.
Notable Insight
Anomaly detection found unusual ridership patterns on 4% of complaint days at 14 St - Union Sq and 11.12% at 74 Broadway - Jackson Heights, suggesting ridership behaved unexpectedly on those days.
Geographic Hotspots